Blog post
Reciprocal tariffs: some simulations
Published 4 April 2025
We simulate the possible effects of the US Reciprocal Tariffs using a modern trade model accounting for global supply chain linkages. The US will suffer the most, potentially losing $1,900 per capita yearly. In case countries retaliate, the losses could increase to $2,300. Canada and Mexico are the second most affected countries. As the UK faces lower tariffs than other countries, its losses are modest, ranging from -0.1% to -0.3% of GDP. If it eventually manages to negotiate an exemption while everybody else does not, it could even make small gains.
On Wednesday, the US President Donald Trump announced an unprecedent series of tariffs on virtually all countries from which the US imports goods. The tariffs, which are implemented on national security grounds, might mean the end of the world trade order as we know it, and signals the end of the US’s support for that multilateral trading system.
The so-called ‘Reciprocal Tariffs’ are country specific and depend on the trade deficit that the US runs with that country, as illustrated by the USTR. Much has already been written about the flimsy basis underpinning these tariffs (see for instance this UKTPO publication), and we do not discuss this further here, as the aim is to focus on the possible impacts.
The general rule is that all imports into the US will pay an additional 10% duty starting from April 5th. For some countries, the additional duties will be increased starting from April 9th.
These additional duties are applied on top of all other existing measures. This means that, if a product has a Most Favoured Nation (MFN)1 tariff of 5%, the additional 10% tariff bring the tariff rate to 15%.
As the UK does not run a trade surplus in goods with the US (the core criterion used to calculate the Reciprocal Tariff), it will only face an additional 10% tariff when exporting to the US, to be paid by the importing firms.
China will be hit particularly hard. The new additional rate for China is among the highest, at 34%, and it comes on top of the 20% extra duties applied at the beginning of March. This means that, starting next week, imports from China will be taxed 54% on top of what is already there – e.g., MFN tariffs, antidumping duties, other taxes.
Canada and Mexico were spared from the new round of tariffs, as they were already targeted by additional tariffs earlier this year. On the same grounds, the Reciprocal Tariffs do not apply to the already targeted metal and automotive products.
There are also other exceptions: for copper, pharmaceutical, semiconductors, wood products, critical minerals and energy products. These are not negligible: for instance, we calculate these products to be worth about 21% of total US imports from the UK.
In our modelling, we consider part of the Reciprocal Tariff package, also the additional duties introduced by the US earlier this year on China, Canada and Mexico, steel and aluminium, and automotive – for details, see the methodological note. We model four different scenarios:
- Scenario 1: the US implements the reciprocal tariffs on all partners
- Scenario 2: same as 1, but the UK is exempted
- Scenario 3: same as 1, plus all countries retaliate charging US imports half the Reciprocal tariff charged by the US on their exports2
- Scenario 4: same as 3, but only the EU, Canada and China retaliate
Scenario 1 shows what could happen if the US applies its Reciprocal Tariffs and other countries do not respond. Scenario 2 models a possible exemption of the UK from the tariffs – what would happen if Starmer’s negotiations are successful.
In Scenario 3 every country retaliates. While Canada and China already partly retaliated, the new tariffs might spur more retaliation. While lacking information on how countries might respond, we believe that, at least initially, it is unlikely that countries will retaliate across the board, or at the level of the US. Therefore, we simply assume that all countries retaliate with half the rate charged by the US on them. For instance, as the additional tariff on the EU is 20%, the EU retaliates with a +10%.
In the last scenario, we assume that only the EU, Canada and China retaliate. These countries have been the most vocal about a muscular response to the US and, due to the large share of US exports directed to them, are those that can do more harm to US firms. We therefore look at a scenario where these three countries retaliate while all others do not.
To understand the impact of the tariffs in simple terms, the modelling focuses on changes in real GDP. The changes in real GDP arise from changes in production and trade as a result of the changes in tariffs across 30 goods and services sectors and for 13 countries (plus a Rest of the World aggregate) covering all global trade and production – see the methodological note for modelling details.
The results suggest that the United States shoots itself in the foot loosing between -2.8% and -3.4% across the four scenarios – see Figure 1. This translates into annual losses of $660-800 billion, or $1,900-2,300 per capita. This is not very far from our earlier estimates.
The other most affected countries are its closest trading partners, Canada and Mexico. For Canada, the losses are between -1.9% and -2.4%, the largest occurring when every country retaliates. For Mexico the losses are slightly smaller, around -1%.
The fourth country in the ranking is Switzerland, losing 0.7-1.1% of real GDP. Switzerland rather than China at the fourth place? It might be surprising at first sight, but we note that a large portion of Swiss sales are destined to the US. Moreover, Switzerland is targeted with a +32%.
Figure 1 also shows the share of a country’s goods sales going to the US – including domestic sales. We can see an almost perfect correlation between the rank of real GDP losses and the rank of US sales share. That is, the more dependent you are on the US, the more the tariffs will hit you.
Figure 1: Changes in real GDP and share of sales to the US
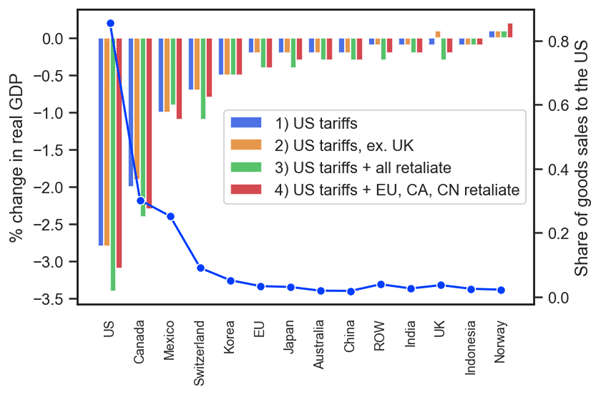
Other factors contribute, too. The UK for instance sees a lower additional tariff (+10%) than most other similar countries (e.g., the EU gets +20%), giving the UK a relative advantage in the US market. Overall, the UK would face only limited losses in the range of -0.1% to -0.3% of real GDP. In monetary terms, they amount to £2.6-7.7bn, or £37-111 per capita. In the scenario where the UK manages to get a deal and is exempted from the extra tariffs, the country is set to make a positive gain of +0.1%. Such a deal might come at the cost of losing all its friends – a high price to pay during hard times. Note, however, that whether the UK is exempted or not, makes almost no (economic) difference to the other countries.
Norway appears to be the winner out of this. The reason is that most of its exports are oil, and, while the Reciprocal Tariffs do not apply to oil, Canadian oil is taxed. As Canada is the largest oil supplier to the US, Norway has something to gain.
The two big enemies of Mr Trump, the EU and China, are somewhere in the middle of the welfare losses distribution. The EU could lose between 0.2-0.4% of real GDP, while for China the loses are around 0.2-0.3%.
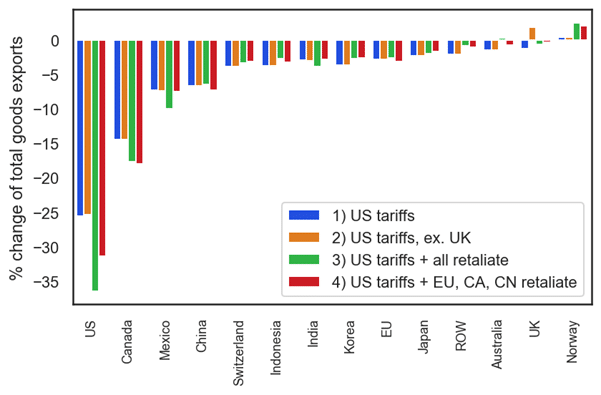
In Figure 2 we report changes in goods exports to the world by country. Again, the US is the most affected country. Almost all countries lose across all the four scenarios, with three exceptions. First Norway, which appears to gain in any scenario. As explained before, this is due to oil exports from Canada being taxed while others are not.
Second, the UK could increase its exports by 1.8% if it is the only country excluded from the US tariffs. Lastly, Australia would see a positive albeit very small change in scenario 3. Australia, together with UK and the Rest of the World (ROW) aggregate, faces the smallest tariff increase among exporters to the US.
Figure 2: Changes in goods exports to the world by country
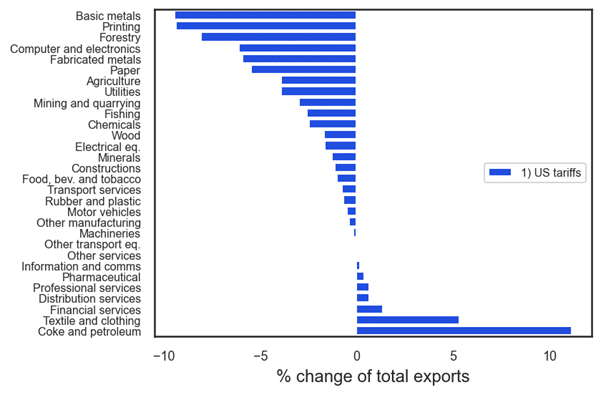
Finally, in Figure 3 we report the changes in UK exports to the world for the UK under scenario 1 – the US imposing tariffs and no retaliation. Most sectors would see a reduction in global sales. The most affected are basic metals, for which the tariff increases by 25% globally, followed by printing activities, both with export falls close to 10%. On the other hand, services sectors can see positive changes –apart for transport services, a sector closely involved in the movement of goods. Coke and petroleum products see an increase in exports due to Canada and Mexico being the only two countries against which the US increases tariffs. Textile and clothing also see an increase in British exports as US imports are diverted from other large exporters such as China which facing much higher tariffs than the UK.
Figure 3: Changes in UK exports to the world by sector
Overall, the simulations show that there is little to cheer for. Across all scenarios, almost all countries see negative changes in real GDP. Economically, retaliation will generally make things worse, but countries might have various reasons to respond vigorously to the US tariffs, or not.
Many things will change in the future months. Deals, retaliations and possibly even more tariffs from the US. The world trading system as we know it might have just ended.
Methodological note
In this analysis, I employ a modern quantitative trade model based on the framework outlined by Costinot and Rodriguez-Clare (2014). This model is widely used to study the impact of trade policies and has been adapted here to explore the effects of tariffs and trade adjustments across sectors and countries. Key features of the model include:
1. Perfect Competition and Balanced Trade: The model assumes that all sectors operate under conditions of perfect competition. Additionally, the model assumes balanced trade. Practically, this means that the trade matrix is “balanced” before running the simulation. Details of the procedure can be found in Costinot and Rodriguez-Clare (2014).
2. Trade in Intermediate Products: The model incorporates both final goods and intermediate products. Firms from different sectors in each country use intermediate inputs, which are sourced either domestically or from international markets.
3. Sectoral and Geographic Coverage: The model covers 30 distinct sectors, including both goods and services, across 13 countries plus an aggregate for the rest of the world. The dataset gives full coverage of global trade and production.
The data required for this analysis includes the base inter-country input-output table, base tariff data and estimates of the trade elasticity to variable costs. The base trade data comes from the Eurostat FIGARO Inter-Country Input-Output (ICIO) tables for 2022.
Tariff data is sourced from the UN TRAINS database, using the most recent available information for the year 2022. This allows the analysis to account for the latest tariff structures affecting international trade.
Following Costinot and Rodriguez-Clare (2014), I adopt trade elasticity estimates from Caliendo and Parro (2015), which quantify how sensitive trade flows are to changes in trade costs.
We consider part of the Reciprocal Tariffs package all tariffs that were announced by the Trump administration in 2025. These include the tariffs announced on, the tariffs on Canada and Mexico, on auto, metals and China.
The base rate for simulation is the tariff as per 2022. The Reciprocal Tariffs are added on top of the 2022 rates. For China, we cumulate the 20% implemented in March with the 34% announced yesterday, adding 54% to the 2022 rate.
For Canada and Mexico, the US introduced an additional 25% tariff, but products compliant with USMCA rules of origins are exempt. We therefore consider only a 12.5% additional tariff for Canada and Mexico.3 For Canadian oil and energy products (sector 19), which is taxed at an additional 10%, we add a tariff of +5%.
Footnotes
- MFN tariffs are the standard or "normal" tariffs that a country applies to imports from other WTO members. The WTO's MFN principle states that countries must treat all WTO member countries equally in terms of trade, meaning they can't discriminate between them.
- As the actual extent of any retaliation by any country is unknown, this is a stylised experiment aimed at capturing what might be the consequences of retaliatory actions.
- The preference utilisation rate – the share of imports coming under preferential regime – of US imports from Canada and Mexico in 2013-15 was 63% on average across HTS 10-digit products. As an approximation, we consider that half of US imports from Canada and Mexico are compliant with USMCA rules of origin.
Note: The data for the graphs and charts is available on request, please email info@citp.ac.uk
Author Profile
