Briefing Paper
Certainty pays off: The tangible trade benefits of the UK-India trade agreement (that no one talks about)
Tamberi, N. Borchert, I. Ubaldo, D. M. (2026) Certainty pays off: The tangible trade benefits of the UK-India trade agreement (that no one talks about), CITP Briefing Paper 29
Published 26 January 2026
Briefing Paper 29
Key points
- The UK-India trade agreement will lift the uncertainty that currently affects Indian exports to the UK, increasing Indian goods exports to the UK by 9% on average solely because of policy predictability, which comes in addition to the trade gains arising from the various policy changes in the agreement.
- The largest trade gains from lower uncertainty-related trade costs are found in ‘rubber and plastic’ products (+29%) and in ‘textile and clothing’ (+25%), respectively, and in sectors that produce agricultural and light manufacturing products.
- The concentration of trade gains in textiles and agricultural and light manufacturing demonstrates that policy predictability benefits sectors that are salient for India’s economic development.
- The majority of UK-India bilateral trade consists of services, which might benefit analogously from certainty about services trade policies, but these potential trade gains are not included in this study.
- The UK’s exports to India are not affected by uncertainty (and its reduction) in the same way since India does not grant uncertain preferences to UK exporters.
The world of stable, rules-based trade policy making as we knew it no longer exists. Current US trade policy, with its bilateral tariff rates that have repeatedly been paused, modified, and occasionally rescinded, is at the epicentre of this new trend. But even beyond that latest source of policy volatility, most governments have been, and still are, adjusting their trade policies in response to geopolitical frictions and new challenges such as climate change. These policy adjustments create uncertainty, which is magnified when supply chain trade straddles across multiple countries, especially when the US economy is involved.
Ambiguity over the nature, scale, or timing of trade policy interventions makes it difficult for businesses to plan the profitability of their international sales, and thereby deters trade. In this volatile environment, certainty about future trading conditions is highly prized. Trade agreements of a binding legal nature, with enforceable commitments and dispute settlement provisions, can deliver the stability that businesses require for conducting international trade. It is therefore natural—although not widely appreciated—to regard the certainty imparted by a trade agreement as a separate source for trade gains above and beyond the gains that derive from the actual improvements in market access through lowering tariff and non-tariff barriers (NTBs).
Why a proper trade agreement is worth more than a ‘deal’
We apply this perspective to the UK-India Comprehensive Economic and Trade Agreement (CETA), an international treaty whose provisions are given effect through national ratification procedures. It is thus reasonable to regard the new bilateral trading conditions stipulated in this agreement as reliable and robust, the more so as it entails a dedicated chapter on dispute settlement (Chapter 29). Whilst the UK Government and others have looked at how much bilateral trade the UK-India agreement might generate as a result of both countries’ commitments to reduce tariffs and other policy barriers, its benefits in terms of stability and planning security have not yet been quantitatively assessed. As this appears to be a rather important aspect in today’s highly volatile world, we conduct a model-based simulation to quantify the contribution of reduced uncertainty for UK-India trade.
The future coming into force of CETA will primarily lift the uncertainty that currently affects Indian exports to the UK. This is because, as it stands, the UK unilaterally grants tariff preferences to India as part of its Developing Country Trading Scheme (DCTS). The DCTS affords lower-than-MFN tariffs preferentially to beneficiary countries on selected products; it is the successor framework to the UK General System of Preferences (GSP) scheme that the UK had initially rolled over from the European Union’s GSP after Brexit. The DCTS improves market access for Indian exporters but, like virtually all GSP schemes, entails uncertainty as preferences can be lost at three-year intervals if a country becomes too competitive in specific products.
Moving from the DCTS to a contractual relationship, such as an FTA, removes such uncertainty. Exploiting an overhaul in 2014 of the EU’s GSP rules, a study by Borchert and Di Ubaldo1 (2020) estimate that removing the uncertainty of preferential treatment whilst leaving all other market access conditions the same can increase exports from beneficiary economies by 36% on average. We use the estimates from this study to gauge how, in a similar situation, Indian trade to the UK might be affected by the transition from DCTS preferences to a full Free Trade Agreement (FTA). The UK’s exports to India are not affected by uncertainty in the same way since India does not grant uncertain preferences to UK exporters.
The value of CETA’s uncertainty reduction
We use a ‘New Quantitative Trade Model’ (NQTM) to estimate the certainty effect imparted by CETA. The impact on UK imports from India is inferred from the difference between two model-based simulations that net out the effect on trade of removing tariff barriers, thereby isolating CETA’s pure certainty effect. If Indian exports reacted in the same way to the increase in predictability as developing country exports did in Borchert and Di Ubaldo’s study (see Footnote 1), then the certainty conveyed by CETA would correspond to an average ad valorem equivalent reduction of 2.3% in trade costs across goods sectors, which translates into an increase of Indian exports to the UK by an additional 9% on average, compared with a scenario of tariff removal alone.
Note that this core finding accounts for the fact that, prior to India and the UK entering into an FTA, DCTS-related uncertainty only affects products in which the scheme confers Indian exporters a preferential tariff margin, i.e. products that are subject to a positive UK Most Favoured Nation (MFN) tariff but receive DCTS preferences. For example, products that enter the UK tariff-free—such as forestry and logging products whose UK MFN rates are zero—are not afflicted by uncertain preferences in the first place. This differential exposure of products to uncertainty pre-CETA is fully accounted for in our core finding of 9% higher trade.
Note also that this estimate only refers to additional goods trade. The majority of UK-India trade by value consists of services trade. The exchange of services arguably also benefits from certainty, although the sources of uncertainty may be different. For instance, as part of CETA, “we have agreed a chapter on business mobility, which will lock in access for short-term business travel into India and the UK. This will give UK businesses and professionals a guarantee that existing access to the Indian market will continue.”2 Whilst such business travel may well have been possible prior to CETA, the agreement now provides certainty about the conditions of market access going forward. We do not, however, currently have all the parameters that our model simulations require to back out the trade gains of certainty for services trade. Hence, for the time being, we focus only on the goods part of UK-Indian trade.
Estimating trade effects of certainty
We compute the effects of uncertainty removal on UK-India trade using a new quantitative trade model that is set up to infer trade and welfare changes from any kind of intervention that is associated with a change in trade costs. Since conventional impacts due to lower tariffs and NTBs have been looked at by others, including by the Department for Business and Trade3, here we are interested in isolating the pure certainty effect on trade, which we infer by comparing two NQTM simulations, one of which sets all tariffs between UK and India to zero and the second simulation does the same but additionally considers the trade-enhancing effect of lower uncertainty for India’s exports to UK. The difference between these two outcomes nets out the conventional trade response to changes in market access conditions.
As a tool for general equilibrium analyses, NQTM simulations require data on trade flows (full bilateral trade matrix of all countries involved) and trade frictions (tariffs), plus knowledge of some structural parameters. Regarding bilateral trade flows, we define a world for the general equilibrium analysis that consists of 18 “countries”, namely the UK and India, as well as 15 of their most important trading partners, respectively, and a Rest-of-the-World (ROW) aggregate.4 Bilateral trade data is taken from Eurostat’s FIGARO tables for the year 2022. Product-level bilateral trade flows are aggregated to a level of 30 sectors in total. Lastly, tariff data is obtained from WITS for 2022 (ISIC rev. 3.1 format) and converted to the ISIC rev. 4 classification.
Equipped with this data, setting up the simulation that models the trade impact of both tariff and uncertainty changes entails two principal steps. First, we need to find the ad valorem equivalent (AVE) trade cost change that is associated with the change in uncertainty, as trade cost changes in AVE terms are the standard exogenous shock fed into NQTMs to find the associated trade and welfare responses. Second, we need to allow for the fact that not all products are subject to uncertainty in the first place, which implies computing correspondingly weighted uncertainty AVEs. We explain each step in turn.
Step 1: uncertainty AVE
Lowering uncertainty for businesses arguably reduces trade costs, albeit in non-pecuniary terms. To find the associated trade cost change, we use an estimate of the sensitivity of bilateral trade flows to uncertainty removal from the literature. We then turn this estimate into a trade cost change in ad valorem terms using structural gravity theory.
Our earlier research by Borchert and Di Ubaldo (see Footnote 1) exploits an episode of GSP reform in 2014 during which, for a specific group of beneficiary developing countries, the only change consisted of having the potential threat of preference loss removed, whilst all other conditions of actual market access stayed the same. In such a situation, we can observe the trade flow response to uncertainty removal. Using a Poisson Pseudo-Maximum Likelihood (PPML) estimation framework and a triple difference specification with a stringent set of fixed effects, the coefficient estimate of uncertainty removal for those products whose uncertain GSP preferences were replaced by reliable FTA provisions is beta hat = 0.306. This estimate means that exports of products that benefited from uncertainty removal increased by 35.8% after the GSP reform, as compared to products and beneficiary countries that did not benefit from this aspect of the GSP reform.
From the vantage point of structural gravity theory for trade flows, this estimation coefficient can be interpreted in terms of structural parameters as follows:
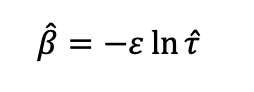
In this expression, 𝜏ˆ = τ'/τ is the proportional change in trade costs and ε denotes the trade elasticity. As we have a numerical estimate of the estimated coefficient beta hat that represents the (partial) effect on trade values of removing uncertainty, we can back out the trade cost change as long as estimates of the trade elasticity are also available. Adding a sector subscript s, AVE trade cost estimates can be computed as:
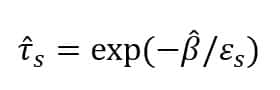
Computing these trade cost changes at the sectoral level greatly increases the accuracy of the simulation because values for εs can differ widely across products and hence sectors. We obtain values for sectoral trade elasticities from Fontagné, Guimbard and Orefice’s detailed estimates5, which are based upon data from the World Input-Output Database 2016 Release and are publicly available from a dedicated website.6
Step 2: products subject to uncertainty
As mentioned above, the uncertainty captured by the coefficient beta hat does not affect all products, but only those for which a contractual trade agreement would in fact eliminate the uncertainty of preferences. In other words, the AVE trade cost change τ ̂s only applies to products that have a positive (i.e. above zero) MFN tariff rate and feature a preferential DCTS rate that is lower than the products ordinary MFN tariff.
Hence, the next step involves the appropriate adjustment of the AVE trade cost changes using the share of trade subject to uncertainty. Doing so will lead to “weighted uncertainty AVEs.”
We identify relevant products by comparing UK MFN and DCTS tariffs for the year 2023 at the Combined Nomenclature 8-digit level (CN8) obtained from the World Bank’s World Integrated Trade Solution (WITS). As tariffs follow a product classification whereas the NQTM simulations are set up on a sectoral (industry) classification, we concord the CN8 products to the Classification of Products by Activity (CPA) nomenclature.7 That tariff information is then aggregated up to the level of sectoral aggregation that we find in the trade dataset, i.e. the FIGARO input-output tables, and at that level we compute the share of CN8 products that exhibit a positive preferential tariff margin. These shares enable us to compute the AVE of uncertainty removal at the sectoral level of the trade data.
Let Ushares denote the share of products within a sector s that are subject to DCTS uncertainty prior to CETA, as explained above. Then the “weighted uncertainty AVEs” at the sectoral level are:

On average across goods sectors, using our earlier estimate of trade’s responsiveness to uncertainty, combined with Fontagné, Guimbard and Orefice’s trade elasticities, we find that the transition from unilateral preferences to a contractual trade agreement corresponds to a reduction in trade costs of 2.3% in ad valorem terms.
The highest trade cost reductions are in sectors such as ‘rubber and plastic’ (-5.3%), ‘textiles and clothing’ (-5.1%), and in ‘crop and animal production’ (-4.4%), respectively. The share of products within a sector that benefits from preference margins is, unsurprisingly, a major driver of the gains from uncertainty removal. Accordingly, this share is high—86% and 84%—for rubber/plastics and textiles/clothing, respectively. The ad valorem equivalent costs of GSP uncertainty are summarised in Figure 1.
Main findings: changes in trade values
In order to net out general equilibrium effects across the 18 economies in the model, we present the trade gains from policy certainty as the ratio of gains in a simulation with tariff and uncertainty reduction relative to a simulation with tariff reduction only. In that way, a ratio exceeding the value of 1 indicates the magnitude of the extra trade gain in percentage terms.
The trade gains range from +29% in ‘rubber and plastic’ to essentially nil in a few sectors that do not encompass any products with preferential margins such as ‘mining’ or ‘forestry and logging’ (see Table 1). Five sectors record certainty trade gains in excess of 20%, including the quantitatively largest sector in trade value terms, ‘textiles and clothing’ (+25%), but also fishing and aquaculture (+28.5%), motor vehicles (+25.6%), and chemicals (+20.6%). This represents a balanced mix of sectors that includes both agricultural and light manufacturing products. The salience of textiles exports for development, with its broad-based employment in small and medium-sized enterprises, is self-evident, and the automotive and chemical industries are known for their deep value chain integration.
Gains in other sectors that are worth mentioning on account of relatively high trade volumes are ‘food, beverages and tobacco’ (+15.5%), ‘coke and refined petroleum’ (+9.6%), ‘machineries’ (+8.7%) and ‘other transport equipment’ (+9.7%), some of which are closely linked to the motor vehicles sector, which is the sector with the third highest gains ratio (see Table 1). They seem to form a larger cluster of industries around mobility and transport equipment that benefit particularly from higher predictability.
Across all the 21 goods-trading sectors, the uncertainty reduction increases Indian exports to the UK by 9% on average. This result, and the distribution of gains across sectors, highlights the fact that the benefits of a UK-India trade agreement extend beyond the direct reduction of tariffs and NTBs. It is instructive to juxtapose this figure to the conventional gains that derive from incremental better market access due to negotiating lower tariffs and NTBs. For the case of CETA, the Department for Business and Trade (DBT) has published its impact assessment of this FTA, which sees UK imports from India of goods and services increase by 9% due to a reduction in tariffs and NTBs. Although the numbers are not strictly speaking comparable because of different models used and different data, the average gains from more certainty (an additional 9%) appear to be approximately as large as the gains from better market access. It is also the case, reassuringly for the plausibility of our results, that two of the sectors that benefit the most from reductions in uncertainty (motor vehicles and textiles) are amongst those expected to record the largest direct trade increases according to DBT.
To summarise our results, Figure 2 plots the percentage changes in trade due to the reduction in uncertainty against the AVE of the uncertainty cost reduction, with the size of each bubble proportional to the initial value of India’s exports to the UK for the sector.
The figure shows that Indian exports to the UK grow considerably more in sectors with higher uncertainty reduction (top left of the graph). At the same time, the relationship between trade cost reductions and trade growth is not exactly linear, as changes in trade values also depend on other factors such as how responsive the sector is to changes in trade costs (the trade elasticity), the share of products within a sector that were subject of uncertainty, and conditions of competition in the sector.
Amongst all affected goods sectors, ‘textile and clothing’ is of particular relevance as this sector sees a large reduction in uncertainty-related trade costs and simultaneously exhibits substantial export growth. The ‘chemicals’ sector also sees a reduction in uncertainty AVE of more than 3% and a considerable increase in exports. On the other hand, the automotive industry has a smaller reduction in uncertainty-related trade costs, with an AVE of 2.4%, but a large increase in exports. This is due to the fact that, in our model, this sector is highly responsive to changes in trade costs, more so than other sectors.
Services sectors are located at the bottom right corner of Figure 2, as they are the biggest sectors in terms of trade value for UK-India trade but see no change in GSP-related uncertainty, which is linked to tariffs. Whereas our modelling speaks only to uncertainty related to preferential tariffs in goods trade, it is not far-fetched to see how there would equally be scope for a sizeable increase in UK-India services trade provided that the trade agreement also offered policy certainty for services. This is a conjecture, though, that would need to be investigated further and that is outside our current model as presented in this paper.
Conclusion
Predictability is a precondition for businesses to plan ahead. Hence, creating clarity over future trading conditions is an important channel through which FTAs can facilitate more trade. Indeed, the cost of uncertainty itself often outweighs the costs imparted by tariff (“Uncertainty is the new tariff”8). Our results demonstrate that the benefits of reliable trading conditions are quantitatively large in the context of the UK-India trading relationship.
The legal nature of CETA as an international treaty contrasts with other agreements that the UK has recently concluded, for instance with the United States9 and the European Union10. These agreements, which are more akin to memoranda of understanding, do not attain the same level of obligation as CETA. In light of our simulations, it is worth emphasising that non-binding deals cannot deliver the kind of certainty gains that characterise the UK-India agreement.
Moreover, our results are conservative estimates—representing a lower bound—insofar as they refer to goods-trading sectors only when the majority of UK-India bilateral trade in fact consists of services. The inclusion of certain aspects of services trade policy in binding agreements—e.g. cross-border services trade, cross-border data flows, investment, and business mobility—can also convey predictability to foreign service providers that is absent for those that rely on unilaterally applied services trade policies. It is, therefore, reasonable to assume that services trade would also benefit from locking in these services trade policies. However, we currently lack the required parameter estimates for services trade that would be needed to run the same simulations for services trade as well.
Table 1: CETA simulated trade gains from uncertainty removal
| Sector | Simulation gains | Ratio | Pref share | Trade elasticity | AVE Reduction (%) | Initial trade values (USDm) | |
|---|---|---|---|---|---|---|---|
| Tariffs only | Tariffs and uncertainty | ||||||
| Rubber and plastic | 484.8 | 625.3 | 1.29 | 0.8634 | 4.8373 | -5.29 | 432 |
| Fishing and aquaculture | 22.2 | 28.5 | 1.28 | 0.8505 | 11.9783 | -2.15 | 7 |
| Motor vehicles | 440.1 | 552.7 | 1.26 | 0.7618 | 9.5870 | -2.39 | 288 |
| Textile and clothing | 4597.8 | 5751.7 | 1.25 | 0.8408 | 4.8291 | -5.16 | 3358 |
| Chemicals | 711.2 | 857.5 | 1.21 | 0.6347 | 5.0896 | -3.70 | 666 |
| Other manuf | 919.8 | 1075.2 | 1.17 | 0.5330 | 4.6427 | -3.40 | 874 |
| Pharmaceutical | 490.6 | 569.6 | 1.16 | 0.5084 | 5.0896 | -2.97 | 455 |
| Food, beverages and tobacco | 1245.2 | 1437.7 | 1.15 | 0.4894 | 4.1602 | -3.47 | 759 |
| Electrical equipment | 469.8 | 531.8 | 1.13 | 0.4238 | 5.0381 | -2.50 | 447 |
| Minerals | 197.0 | 219.8 | 1.12 | 0.3750 | 6.2501 | -1.79 | 173 |
| Other transport eq | 670.4 | 735.3 | 1.10 | 0.3238 | 3.2721 | -2.89 | 660 |
| Coke and refined petroleum products | 1256.9 | 1377.7 | 1.10 | 0.3302 | 3.8531 | -2.52 | 1226 |
| Fabricated metals | 293.8 | 319.8 | 1.09 | 0.2902 | 7.2301 | -1.20 | 267 |
| Machineries | 752.9 | 818.4 | 1.09 | 0.2879 | 8.0159 | -1.08 | 697 |
| Crop and animal production, hunting and related service activities | 204.3 | 221.9 | 1.09 | 0.2902 | 1.8497 | -4.42 | 185 |
| Wood | 54.5 | 59.0 | 1.08 | 0.2737 | 5.3331 | -1.53 | 49 |
| Basic metals | 431.6 | 453.4 | 1.05 | 0.1699 | 6.8225 | -0.75 | 387 |
| Computers | 255.1 | 261.8 | 1.03 | 0.0913 | 4.5532 | -0.59 | 247 |
| Paper and printing | 104.4 | 105.0 | 1.01 | 0.0238 | 4.8480 | -0.15 | 99 |
| Forestry and logging | 7.4 | 7.4 | 1.00 | 0.0000 | 0.5250 | 0.00 | 7 |
| Mining | 48.5 | 48.3 | 1.00 | 0.0000 | 13.9672 | 0.00 | 432 |
Footnotes
- See Borchert and Di Ubaldo (2020), “Go ahead and trade: the effect of uncertainty removal in the EU’s GSP scheme”, RSCAS Working Paper 2020/15, European University Institute, available at https://cadmus.eui.eu/handle/1814/66268.
- See UK Department for Business and Trade: “UK-India Free Trade Agreement Business Mobility explainer”, published 23 July 2025; available at https://www.gov.uk/government/publications/uk-india-free-trade-agreement-business-mobility-explainer/uk-india-free-trade-agreement-business-mobility-explainer.
- See https://www.gov.uk/government/publications/uk-india-free-trade-agreement-impact-assessment/impact-assessment-of-the-free-trade-agreement-between-the-uk-and-india-executive-summary-web-version.
- The 18 “countries” are Australia, Brazil, Canada, Switzerland, China, EU-27, UK, Indonesia, India, Japan, Korea, Mexico, Norway, Russia, Turkey, US, South Africa, and ROW.
- See Fontagné, Guimbard and Orefice (2022), “Tariff-based product-level trade elasticities”, Journal of International Economics vol. 137, DOI: https://doi.org/10.1016/j.jinteco.2022.103593.
- See https://sites.google.com/view/product-level-trade-elasticity.
- CPA is a product classification that follows the same structure as NACE, which is an industry classification, at the 4-digit level. NACE rev.2 codes match ISIC rev.4 codes at the 2-digit level; as such, it is the closest correspondence table we have between product and industry codes. These correspondence tables are provided by Eurostat.
- See https://unctad.org/news/uncertainty-new-tariff-costing-global-trade-and-hurting-developing-economies.
- The UK-US Economic Prosperity Deal (EPD) agreed on 8 May 2025, see https://www.gov.uk/government/publications/us-uk-economic-prosperity-deal-epd.
- The new Strategic Partnership following the UK-EU Summit on 19 May 2025, see https://www.gov.uk/government/publications/ukeu-summit-key-documentation/uk-eu-summit-joint-statement-html.
Author Profiles

Nicolò Tamberi

